

eNPS calculation: Formula, steps, and how to do it right
eNPS calculation is the process used to quantify employee sentiment based on how likely they are to recommend their workplace. While the eNPS formula appears simple, most organizations misread results due to poor data quality and weak interpretation. Accurate eNPS score calculation requires more than applying a basic model.
This guide breaks down how to calculate eNPS using tested frameworks, focusing on measurement accuracy, context, and what actually makes eNPS a reliable decision-making metric in practice. This approach helps connect employee satisfaction, employee engagement, and employee sentiment to a measurable outcome.


- Employee net promoter score (eNPS) is a loyalty metric using the eNPS calculation formula, subtracting detractors from promoters to produce an eNPS score range.
- Well-designed eNPS surveys uncover employee feedback patterns, and eNPS survey provider tools ensure accurate employee net promoter score calculation.
- Enps score interpretation with eNPS scale benchmarks and internal nps comparisons helps analyze eNPS engagement gaps.
- Strategies including recognition, communication, growth, and eNPS training improve employee net promoter score benchmarks
- CultureMonkey’s eNPS survey software automates eNPS surveys and delivers actionable insights.
What data is required for accurate eNPS calculation?
Accurate eNPS calculation requires four key data elements: a standardized eNPS question, a 0–10 eNPS scale, response distribution across categories, and sufficient participation. Without these inputs, the eNPS metric cannot reliably represent employee sentiment. The eNPS metric is adapted from the Net Promoter Score (NPS), which measures customer loyalty.
To calculate eNPS reliably, you need:
Standardized question
Use a single eNPS survey question across all eNPS surveys:
“On a scale of 0–10, how likely are you to recommend your company as a place to work?”
This ensures employee feedback is structured correctly and reflects real employee responses.
Defined eNPS scale and classification
To calculate eNPS, HR should categorize employee responses into three groups: promoters, passives, and detractors.
Apply eNPS scoring consistently:
9–10 → Promoters
7–8 → Passives
0–6 → Detractors
Total responses and category counts
Accurate employee net promoter score calculation requires the total number of responses and the count of promoters and detractors before applying the employee net promoter score formula.
What is the eNPS formula?
eNPS = % of promoters − % of detractors. Promoters score 9–10, passives score 7–8, and detractors score 0–6. Passives count in total responses, but only promoters and detractors affect the final score.
Worked example:
If 60 employees respond, with 24 promoters, 18 passives, and 18 detractors, the eNPS score is calculated as follows.
Promoters = 24/60 = 40%. Detractors = 18/60 = 30%. eNPS = 40% − 30% = 10.
Clear calculation dependency
Without anonymity, eNPS surveys tend to overrepresent positive sentiment, reducing the accuracy of the eNPS metric.
Anonymity to ensure honest data
Without anonymity, eNPS surveys tend to overreport positive sentiment, reducing accuracy. To gain actionable insights from eNPS, include follow-up, open-ended questions that ask about the reasons behind scores.
When done correctly, this helps HR teams gather feedback and gain valuable insights into employee experience.
What ensures accuracy in practice:
- Participation coverage: Low participation distorts results. Reliable eNPS calculation depends on broad input, not partial response sets.
- Segment-level visibility: To understand net promoter score employee engagement, data should be segmented by team, role, and tenure rather than relying only on a company-wide average. This helps identify areas where engagement levels differ across team dynamics and company culture.
- Qualitative follow-up: Include eNPS questions such as “What is the main reason for your score?” to understand eNPS meaning behind the scores.
- Consistency across cycles: Using a consistent structure ensures the eNPS metric remains comparable over time and avoids misinterpretation.
Employee Net Promoter Score (eNPS) is a metric that reflects employee satisfaction at work. eNPS assesses how likely employees would be to recommend their organization to their friends and family. Confidentiality is essential to encourage honest feedback from employees during the eNPS survey process.
How to measure eNPS across teams, locations, and roles?

To measure eNPS across teams, locations, and roles, standardize the survey, segment responses by key dimensions, and calculate scores separately for each group using the eNPS calculation formula.
Organizations should measure eNPS regularly, typically at least twice a year, to stay responsive to changing employee sentiment.
This reveals differences in engagement that are hidden in a company-wide average.
What you need to do:
- Apply the same calculation method everywhere: Use a consistent approach to how to measure eNPS across all groups. Changing methods between teams or locations makes comparisons invalid.
- Segment responses correctly: Break data by team, location, role, and tenure. This is essential for knowing how to measure eNPS accurately across groups.
- Protect anonymity and data quality: Set minimum response thresholds before reporting segment data.
- Add qualitative context: Use follow-up eNPS questions to understand why segments differ.
- Ensure comparability over time: Use a consistent structure so segment-level results remain comparable.
- Use tools that support segmentation: An eNPS survey tool or eNPS software helps automate segmentation and reduce errors.
Segment-level measurement turns eNPS into a diagnostic system by showing where engagement differs across the organization. The eNPS score can range from -100 to 100, indicating the level of employee advocacy.
(Source: Gallup)
How does sample size affect eNPS calculation accuracy?
Sample size affects eNPS calculation accuracy by changing volatility, margin of error, and reliability. Small samples make the eNPS calculator output unstable and easy to misread, while larger, representative samples make results more precise and trustworthy.
- Small samples create volatility: In a small group, one response can shift the score sharply. That makes short-term movement look larger than it really is.
- Small samples increase margin of error: A low response count creates a wide error range, so changes may reflect statistical noise rather than a real shift in sentiment.
- Larger samples improve precision: As response volume increases, the result becomes more stable and better reflects the workforce instead of a few individual opinions.
- Representativeness matters as much as size: A large sample is still weak if it misses key teams, roles, or locations. Reliable measurement depends on broad and balanced coverage. Without sufficient participation, the scoring system fails to represent most employees accurately.
- Use practical thresholds: Treat 30 to 50 responses as a minimum baseline for directional reading. For stronger confidence, aim for wider participation across the employee population.
- Read small-company data carefully: Smaller companies can still use eNPS, but results should be interpreted directionally and supported with qualitative feedback.
Sample size does not just affect precision. It determines whether the result is usable for decision-making or too noisy to trust. eNPS can serve as a competitive advantage, helping organizations attract top talent and retain their best people.
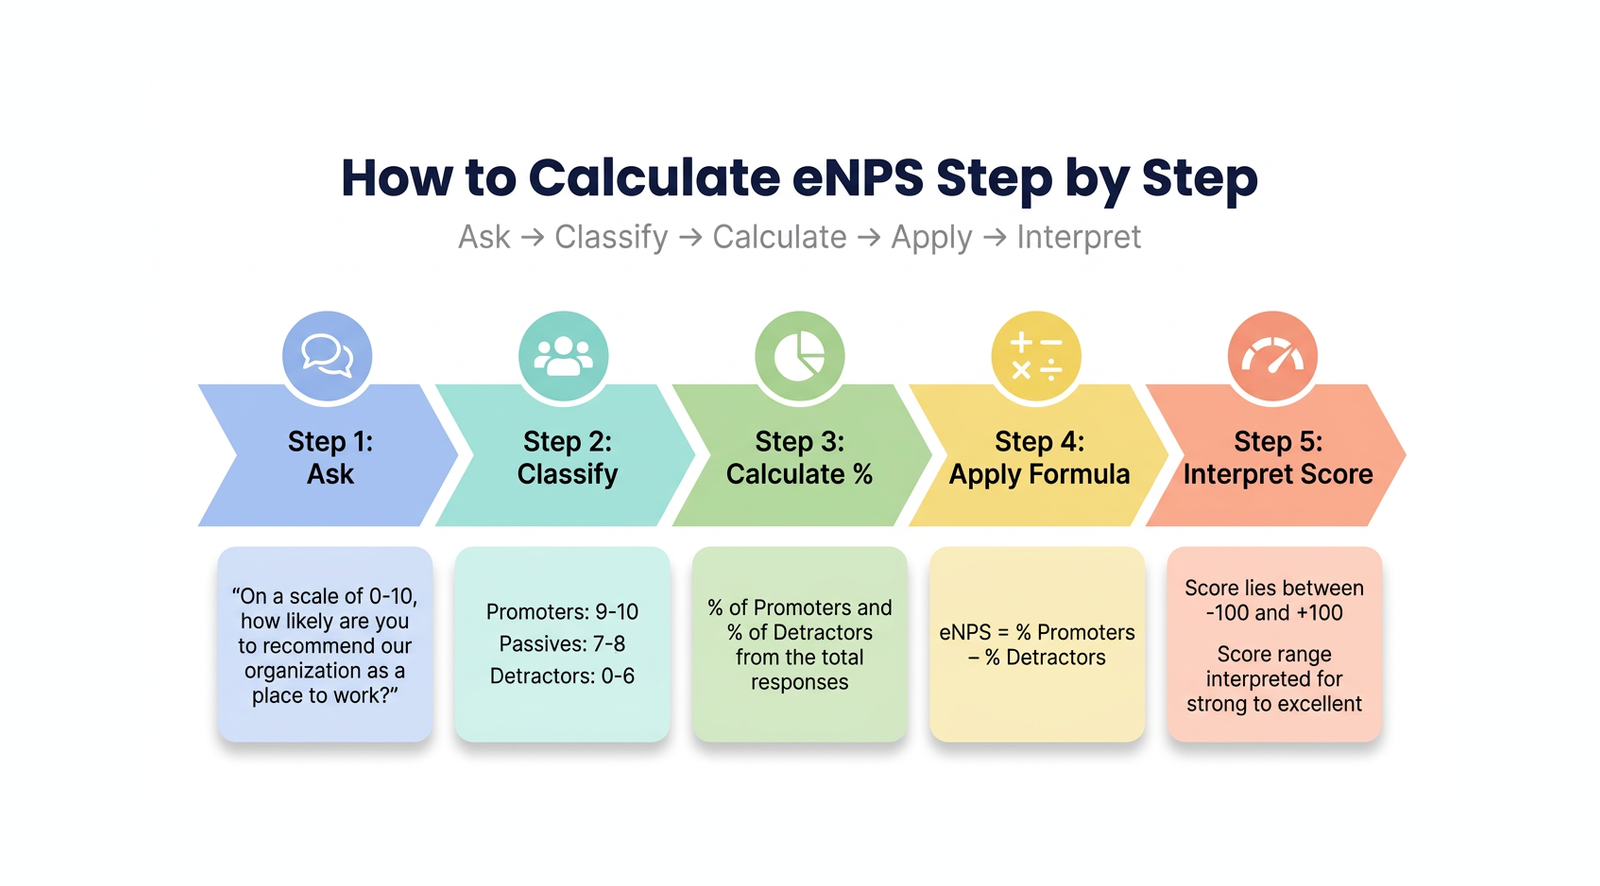
How to calculate eNPS step by step?
To calculate eNPS, ask a standard question, classify responses into promoters, passives, and detractors, calculate their percentages, and subtract detractors from promoters using the eNPS formula.
Step 1: Ask the core question
“On a scale of 0 to 10, how likely are you to recommend our organization as a place to work?”
Step 2: Classify responses
To calculate eNPS, HR should categorize employee responses into three groups: promoters, passives, and detractors.
9-10 = Promoters
7-8 = Passives
0-6 = Detractors
Step 3: Calculate percentages
Find the percentage of promoters and detractors from the total responses.
Employee NPS Calculator
Enter the number of Promoters, Passives, and Detractors from your survey to instantly calculate your eNPS score.
eNPS Benchmarks
Formula: eNPS = % Promoters − % Detractors | Score ranges from −100 to +100
Step 4: Apply the employee net promoter score formula
To calculate eNPS, the number of promoters is subtracted from the number of detractors, and the result is divided by the total number of respondents, then multiplied by 100.
eNPS = % Promoters - % Detractors
This eNPS score calculation helps organizations measure employee loyalty and track changes over time.
Step 5: Understand the score range
The final score lies between -100 and +100. The eNPS calculation ignores passive respondents, focusing only on promoters and detractors, but included in the total response base.
Quick interpretation
Above 0 = positive
Above 30 = strong
Above 50 = excellent
Below 0 = more detractors than promoters
A positive eNPS score indicates generally satisfied employees, while a negative eNPS score highlights disengagement.
eNPS scores can range from -100 to 100, with scores between 10 and 30 considered good, and those between 50 and 70 considered excellent. Scores from 10 to 30 signal healthy advocacy, while scores above 50 indicate exceptional support.
Why the standard eNPS calculation formula is not enough

The standard eNPS calculation formula is not enough because it ignores passive employees, lacks context behind scores, and cannot explain what drives employee sentiment. It provides a single number but does not offer diagnostic insight for decision-making.
Where the formula falls short:
- Ignores passives: Passives (7–8) are excluded from eNPS scoring, even though they often form the majority. This limits the visibility of employees who can shift the overall eNPS score.
- Measures advocacy, not experience: The employee net promoter score formula captures willingness to recommend, not daily work experience or engagement drivers.
- No context behind the score: An eNPS score shows the outcome, but not the reason. Without supporting input, actions remain unclear.
- Masks internal differences: A single eNPS metric can hide variation across teams or roles, creating a misleading average.
- Acts as a lagging indicator: Changes in eNPS scoring reflect issues after they have already impacted engagement, not when they begin.
- Scale limitations reduce clarity: The 0–10 eNPS scale can lead to clustering in the middle, increasing passives and reducing differentiation.
This limits the ability to improve employee engagement and improve employee satisfaction effectively.
What biases affect eNPS calculation results?
eNPS calculation results are affected by biases such as non-response bias, social desirability bias, selection bias, and timing bias. These factors influence how employees respond, making the eNPS metric less reliable.
Key biases to account for:
- Non-response and self-selection bias: Employees with strong opinions are more likely to respond, while neutral employees may not, skewing eNPS scores.
- Selection bias: If certain teams or groups are overrepresented, results do not reflect the full organization.
- Social desirability and anonymity bias: When anonymity is unclear, employees may give safer, more positive responses, inflating the eNPS score.
- Negativity bias: Negative responses tend to be stronger, which can disproportionately lower the eNPS metric.
- Acquiescence bias: Some employees tend to agree or avoid extreme responses, which can inflate eNPS scoring.
- Response style and cultural bias: Different groups use rating scales differently, affecting consistency across eNPS scores.
- Timing and recency bias: Recent events can influence responses, making results reflect short-term sentiment.
- Survey design bias: Leading or unclear eNPS questions can push respondents toward specific answers.
- Method limitation bias: Grouping responses into three categories hides variation within eNPS scores.
- Small sample distortion: Low response volume can amplify extreme responses and reduce reliability.
These factors affect how employees feel and how they provide honest feedback in surveys.
Bias does not change the eNPS calculation formula, but it directly affects how the eNPS metric should be interpreted. Acting on feedback to enhance employee experiences helps build a workforce of motivated individuals who contribute positively to company culture.
How do response rates affect eNPS calculation accuracy?
Response rates affect eNPS calculation accuracy by determining how representative and reliable the results are. Low response rates create skewed representation, while high response rates ensure the result reflects actual employee sentiment.
How response rates impact accuracy:
- Low response rates skew representation: Below 50–60%, results often reflect only extreme opinions, missing the broader workforce.
- Uneven participation distorts results: When certain teams or roles respond less, their experience is not reflected in the final outcome.
- Extreme responses dominate low participation: When fewer people respond, strong positive or negative opinions disproportionately influence results.
- Low participation can inflate scores: Disengaged employees are less likely to respond, which can make results appear more positive than reality.
- High response rates improve reliability: At 70%+, results better represent actual employee sentiment across the organization.
- Results become highly sensitive at low participation: Small shifts in responses can significantly change the outcome when participation is low.
- Passives affect the overall balance: Passives do not directly change the score but influence the total base, shaping how extreme the result appears.
Low participation can lead to employee attrition signals being missed in early stages. High participation improves employee retention by identifying risks earlier.
How to turn eNPS scores into actionable insights?
To turn eNPS scores into actionable insights, analyze qualitative feedback, segment results, track trends over time, and act on root causes. This converts the eNPS score range from a metric into a decision-making input.
How to convert scores into action:
- Analyze qualitative “why” feedback: Use follow-up input to understand what drives the employee nps score. Group responses into themes such as leadership, growth, or workload.
- Identify patterns at scale: Use structured analysis to detect recurring issues across eNPS scores instead of focusing on isolated comments.
- Use segmentation to guide action: Review eNPS scores by team, role, or tenure to identify where intervention is needed.
- Track internal trends over time: Compare results across cycles. Internal movement is more useful than external employee net promoter score benchmark comparisons.
- Act on each group differently: Address detractor issues, move passives toward engagement, and reinforce what works for promoters.
- Communicate and involve employees: Share results and involve teams in discussing solutions to build trust and improve participation.
- Combine with other data sources: Use eNPS surveys alongside engagement and exit data to validate insights.
This helps organizations gain valuable insights and build a complete picture of employee experience. Pair eNPS with other data sources to gain insights beyond survey results.
What do changes in eNPS score actually indicate?

Changes in eNPS score indicate whether employee experience is improving, declining, or stagnating over time. They reflect shifts in promoter and detractor distribution and act as an early signal of engagement and retention risk.
What different changes indicate:
- Rising score indicates improvement: An increase shows more promoters and fewer detractors, reflecting stronger engagement and better employee experience.
- Declining score signals risk: A drop indicates growing dissatisfaction and disengagement, often preceding higher attrition and lower productivity.
- Stable score shows stagnation: No movement suggests employee experience is not improving or changing meaningfully.
- Impact of organizational changes: Sudden shifts often reflect employee reactions to leadership changes, policies, or major events.
- Trend over time matters most: Changes across cycles provide more insight than a single score, showing whether initiatives are working.
- Movement within passives is critical: Shifts in passives indicate whether neutral employees are becoming promoters or detractors.
- Indicator of cultural health: Consistent trends reflect how stable and aligned the organization’s culture is over time.
Organizations should ask open-ended follow-up questions in eNPS surveys to gain qualitative insights that support the numerical data.
Conclusion
eNPS calculation provides a structured way to measure employee sentiment, but its value depends on how accurately it is applied and interpreted. Reliable results require clean data, sufficient participation, and contextual analysis across segments and time. Without this, scores remain directional, not actionable.
CultureMonkey simplifies eNPS calculation by combining automated surveys, segmentation, and real-time analytics, enabling organizations to capture accurate insights, identify root causes, and turn feedback into measurable improvements in employee experience.
Book a demo with CultureMonkey.
FAQs
1. What is a good eNPS score?
A good eNPS score varies by industry, but generally, above 0 is positive, above 30 is strong, and above 50 is excellent. The key is tracking improvement over time and comparing scores within your organization rather than relying only on external eNPS score benchmarks. Always consider context and sample size.
2. How often should you calculate eNPS in a company?
eNPS should be calculated at consistent intervals, typically quarterly or biannually, to track trends without causing survey fatigue. Frequent measurement helps identify changes early, while consistent timing ensures comparability across cycles and more reliable interpretation of results.
3. Why are passive employees excluded from eNPS calculation?
Passive employees are excluded from eNPS calculation because the method focuses on clear promoters and detractors to measure strong sentiment. However, passives are still important as they influence trends, reflect neutrality, and can shift toward promoters or detractors over time if not addressed.
4. Can eNPS be used to measure employee engagement?
eNPS can be used to measure employee engagement at a high level by capturing employee sentiment and willingness to recommend the workplace. However, it should not be used alone, as it does not explain underlying drivers. Combining eNPS with deeper feedback and surveys provides a more complete view of engagement.
5. What is the difference between eNPS and traditional engagement surveys?
eNPS uses a single question to measure employee sentiment and willingness to recommend the workplace, giving a quick, high-level score. Traditional engagement surveys use multiple questions to assess drivers like leadership, growth, and culture, providing deeper, diagnostic insights for action.


